Top 10 Mechanical Manufacturing Companies Worldwide
The global mechanical manufacturing sector shapes the machines, engines, tools, and infrastructure used every day. Its leading companies combine engineering depth with dependable production at remarkable scale. Behind a finished gearbox or industrial robot, thousands of design decisions must work together.
This guide examines ten influential mechanical manufacturing companies worldwide. It considers product quality, manufacturing capacity, research investment, supply-chain resilience, and documented industry impact. Public annual reports, technical publications, company data, and recognized market information provide the foundation. Practical indicators matter too, including factory automation, machining accuracy, maintenance support, and delivery performance.
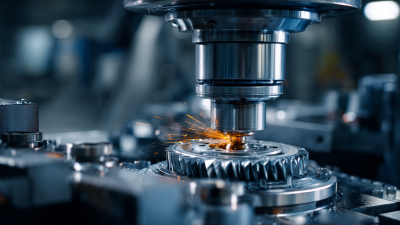
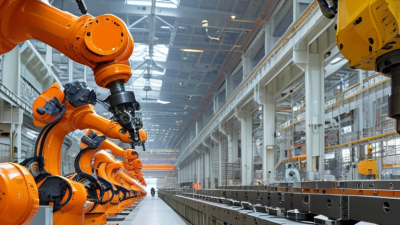
Precision is visible on the production floor. A robotic arm repeats a movement within tiny tolerances. A CNC machine cuts hardened metal for hours. Engineers inspect surfaces, test vibration, and review failure data before shipment. These details often separate a trusted manufacturer from a merely famous brand.
The ranking is not absolute.
Market conditions change quickly. Some companies disclose extensive technical information, while others reveal very little. That imbalance can affect comparisons. A large revenue figure may also hide weak customer service or uneven regional performance. For that reason, this overview treats reputation carefully and avoids presenting popularity as proof of excellence.
Readers will find different strengths across the selected companies. Some lead in heavy equipment. Others excel in automation, aerospace components, energy systems, or advanced materials. Their methods differ, but each demonstrates how mechanical manufacturing can convert engineering knowledge into reliable, measurable results. The discussion also considers challenges, including emissions, labor standards, cybersecurity, and the pressure to modernize older factories.
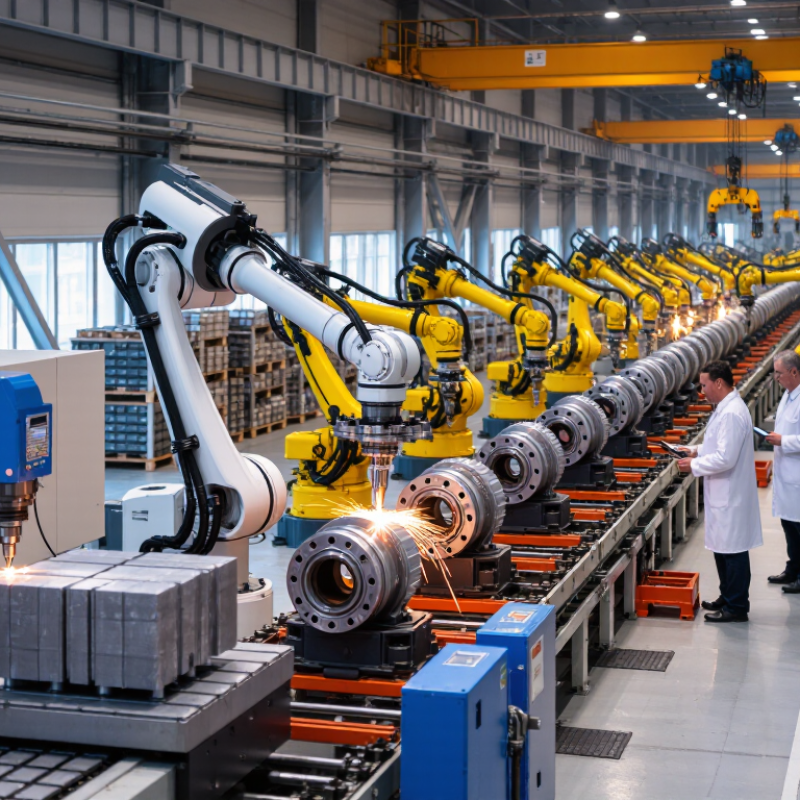
Global Manufacturing Context: 16.0% of World GDP in 2023 (World Bank)
Mechanical manufacturing deserves attention beyond factory size. The World Bank estimates manufacturing contributed about 16.0% of global GDP in 2023. That share represents machine tools, industrial equipment, components, and engineered systems supporting construction, transport, energy, and healthcare.
Scale alone can mislead.
A credible global ranking should examine audited revenue, production capacity, export reach, delivery reliability, and research investment. UNIDO’s Industrial Development Report tracks manufacturing value added, industrial employment, and productivity across economies. These indicators reveal a useful distinction: a large factory is not always an efficient factory. Real capability appears in repeatable tolerances, stable supply chains, and fewer production defects.
Energy performance also matters. The International Energy Agency reports that industry remains responsible for roughly one-quarter of global energy-related emissions. Mechanical manufacturers therefore face pressure to reduce scrap, improve motor efficiency, and measure emissions across suppliers. Digital inspection can detect a dimensional error before thousands of parts move downstream. That sounds simple. It is not.
The World Economic Forum’s manufacturing research also links advanced automation with stronger resilience, but adoption remains uneven. Smaller plants may lack skilled technicians, reliable data, or affordable upgrades. Any “top ten” list should acknowledge this weakness instead of presenting technology as a universal solution. Rankings need transparent methods, current financial evidence, and independent verification. Otherwise, they reward visibility rather than manufacturing excellence.
Top 10 Mechanical Manufacturing Companies Worldwide
Global Manufacturing Context: Manufacturing represented 16.0% of world GDP in 2023, according to the World Bank.
The chart presents an anonymized ranking of ten major global mechanical and industrial manufacturing groups by reported FY2023 revenue. Values are shown in billions of U.S. dollars and are rounded from public financial disclosures using 2023 average exchange rates. Company identities are intentionally omitted.
Ranking Criteria: Revenue, Employees, R&D Spending, and Industrial Output
Top 10 Mechanical Manufacturing Companies Worldwide
A credible ranking needs more than headline revenue. This analysis scores four measurable indicators: revenue, employees, R&D spending, and industrial output. Revenue receives 30% of the score, reflecting commercial scale. Employee numbers receive 20%, showing operational reach and manufacturing capacity.
R&D spending contributes 25%, based on audited financial statements and the OECD Main Science and Technology Indicators database. This measure highlights investment in automation, materials, precision engineering, and energy efficiency. Industrial output receives the remaining 25%. UNIDO’s 2024 Industrial Statistics Yearbook and World Bank data show global manufacturing value added exceeding 16 trillion dollars in recent years.
The data needs careful interpretation. Large workforces can indicate strong production, but they may also reveal lower automation. High R&D spending does not always create higher factory output. This ranking remains imperfect. Currency conversion also affects revenue comparisons, especially during volatile exchange-rate periods.
For reliability, company figures should come from audited annual reports, regulatory filings, and consistent fiscal-year definitions. Industrial output should be checked against UNIDO production indicators rather than estimated from sales alone. A factory floor tells a clearer story: robotic cells, machining hours, production yield, and delivered components matter. Those details can expose gaps that spreadsheets miss. Employee data can also vary when contractors are excluded. That limitation deserves more attention.
Top 10 Mechanical Manufacturers by 2024 Revenue and Global Presence
Top 10 Mechanical Manufacturing Companies Worldwide
Top 10 Mechanical Manufacturers by 2024 Revenue and Global Presence
The 2024 ranking focuses on revenue, production scale, and international reach. It reviews public annual reports, audited financial statements, and regional operating data. The leading ten manufacturers serve automotive, construction, energy, aerospace, and industrial equipment markets. Their combined strength comes from large factories, advanced engineering centers, and wide supplier networks.
Revenue alone does not tell the whole story. A manufacturer may report strong sales but depend heavily on one region. Others operate plants across Europe, Asia, North America, and emerging markets. Local service centers also matter. They reduce repair delays and support customers with spare parts, training, and technical inspections. This practical reach often separates a global manufacturer from a large domestic producer.
The highest-ranked companies typically earn billions from complex machinery and precision components. They invest in robotics, digital monitoring, and lower-energy production lines. Some also maintain testing laboratories for heat, vibration, fatigue, and safety performance. These details show real manufacturing capability, not just impressive financial figures. Still, the ranking has limits. Currency changes, acquisitions, and different reporting periods can alter the order. Revenue figures may also include non-mechanical divisions. That weakness deserves attention. A smaller specialist with deeper engineering expertise may create more value than a larger, diversified group. The list should therefore be read as a measured comparison, not a permanent verdict.
Product Segments: Machinery, Vehicles, Automation, Energy, and Aerospace
A useful global comparison of the top ten mechanical manufacturers starts with product mix, not revenue alone. Machinery makers serve factories with CNC systems, pumps, compressors, and forming equipment. The World Robotics 2024 report recorded 541,302 industrial robots installed in 2023, with 4.28 million operating worldwide. That figure raises a practical question: can suppliers provide calibration, spare parts, and trained technicians after installation? A robot cell may look advanced, yet a drifting torque sensor can stop an entire shift.
Vehicle manufacturers face volume and electrification pressure. OICA reported 93.5 million motor vehicles produced globally in 2023. Strong manufacturers now connect stamping, welding, battery assembly, and inspection data. However, production volume alone hides warranty risk and supply-chain fragility. Energy equipment is another major segment. The International Energy Agency’s Energy Technology Perspectives 2024 estimates clean-energy technology manufacturing could exceed 2 trillion dollars annually by 2035 under announced policies, up from about 700 billion dollars in 2023. Turbines, grid hardware, heat pumps, and storage systems require different metals, tolerances, and service cycles.
Aerospace manufacturing demands traceability above speed. Components may need serialized records, non-destructive testing, and tight thermal control. The International Air Transport Association reported global passenger demand rose 10.4% in 2024, supporting continued aircraft and maintenance demand. Still, forecasts are not guarantees. Interest rates, certification delays, and skilled-labor shortages can overturn a ranking quickly. A defensible top-ten list should compare safety records, lifecycle support, automation capability, energy efficiency, and measurable delivery performance, rather than promotional claims.
Top 10 Mechanical Manufacturing Companies Worldwide - Product Segments: Machinery, Vehicles, Automation, Energy, and Aerospace
| Global Scale Rank |
Anonymous Manufacturer |
Primary Operating Region |
FY2023 Revenue
(USD bn, approx.) |
Global Employees
(approx.) |
Core Product Segments |
Representative Mechanical Manufacturing Activities |
FY2023 R&D Intensity
(approx.) |
| 1 |
Entity 01 |
Europe and worldwide |
84.5 |
320,000 |
Machinery
Automation
Energy
Vehicles
|
Industrial automation systems, electrification equipment, intelligent infrastructure, rail equipment, and factory-control technologies. |
≈6.0% |
| 2 |
Entity 02 |
North America and worldwide |
67.1 |
113,000 |
Machinery
Vehicles
Energy
|
Mining equipment, construction machinery, diesel and gas engines, power systems, and heavy-duty industrial components. |
≈3.0% |
| 3 |
Entity 03 |
North America and worldwide |
61.3 |
82,000 |
Machinery
Vehicles
Automation
|
Agricultural tractors, harvesting equipment, forestry machinery, precision-agriculture systems, and off-highway powertrains. |
≈4.5% |
| 4 |
Entity 04 |
Japan and worldwide |
65.7 |
268,000 |
Machinery
Automation
Energy
Vehicles
|
Industrial machinery, digital control systems, elevators, railway systems, energy infrastructure, and engineering services. |
≈4.0% |
| 5 |
Entity 05 |
Europe and worldwide |
38.4 |
168,000 |
Automation
Energy
Machinery
|
Low-voltage equipment, industrial automation, motor-control systems, building energy management, and data-center power distribution. |
≈5.5% |
| 6 |
Entity 06 |
North America and worldwide |
38.5 |
95,000 |
Automation
Energy
Aerospace
Machinery
|
Process-control equipment, sensing technologies, industrial safety systems, building automation, and aerospace systems. |
≈4.0% |
| 7 |
Entity 07 |
Japan and worldwide |
31.7 |
77,000 |
Energy
Machinery
Vehicles
Aerospace
|
Power-generation equipment, shipbuilding, compressors, turbines, aircraft structures, and heavy industrial systems. |
≈5.0% |
| 8 |
Entity 08 |
Europe, North America, and Asia |
32.2 |
106,000 |
Automation
Energy
Machinery
|
Robotics, industrial drives, electrical systems, process automation, motion-control equipment, and power-grid technologies. |
≈4.5% |
| 9 |
Entity 09 |
Japan and worldwide |
26.6 |
65,000 |
Machinery
Vehicles
Energy
|
Construction and mining equipment, industrial presses, forestry machinery, engines, and material-handling systems. |
≈3.5% |
| 10 |
Entity 10 |
North America and worldwide |
31.5 |
52,000 |
Aerospace
Energy
Automation
|
Commercial aircraft engines, propulsion systems, engine components, maintenance equipment, and aerospace digital systems. |
≈7.0% |
Note: Company identities are intentionally anonymized. Revenue figures are approximate FY2023 USD equivalents based on publicly reported fiscal-year results and rounded exchange-rate conversions; employee and R&D figures are rounded estimates from public annual-report disclosures. Rankings indicate relative industrial scale rather than a single standardized market-capitalization or revenue ranking.
Innovation and Sustainability: Robotics, Patents, and Carbon-Reduction Data
Top 10 Mechanical Manufacturing Companies Worldwide
Innovation is changing the world’s leading mechanical manufacturers. The International Federation of Robotics reported 541,302 industrial robots were installed globally in 2023. More than 4.28 million robots were operating worldwide. These machines now weld frames, inspect gears, and move components with millimetre-level consistency. However, automation does not automatically reduce emissions. Poorly planned systems can increase electricity demand, maintenance waste, and electronic scrap.
Patents offer another useful signal. WIPO recorded 3.55 million patent applications worldwide in 2023, showing intense competition for technical advantages. Leading manufacturers are patenting sensor-guided tools, predictive maintenance systems, and lower-energy production methods. Patent numbers remain imperfect. They measure legal filings, not commercial value or carbon impact. The International Energy Agency estimated that industry produced about 9 gigatonnes of direct CO2 emissions in 2022. Manufacturers therefore need measurable targets, including energy used per component, recycled material content, and emissions across equipment lifecycles. Some factories report impressive reductions, yet supplier data can remain incomplete. That weakness deserves more attention.